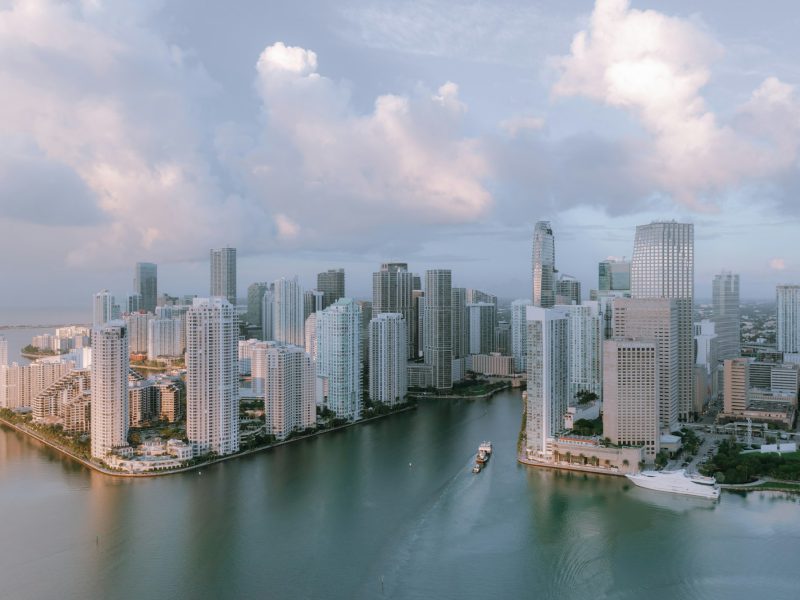
Miami market report: Q3 2026
Prices held firm, inventory finally grew and waterfront homes kept setting records. Here is what the third quarter means for buyers, sellers and renters.
Median prices, price per square foot, inventory and days on market — calculated live from every Doorstep listing, so the numbers move when the market does.
Based on 42 for-sale listings · updated October 7, 2026
Homes for sale
Live data · updated October 7, 2026
| Neighborhood | Median price | Price / sq ft | Listings |
|---|---|---|---|
| Mid-Beach | $8.75M | $1,614 | 3 |
| Key Biscayne | $8.33M | $1,913 | 2 |
| South Beach | $5.45M | $1,879 | 3 |
| Coconut Grove | $4.9M | $1,222 | 2 |
| Bal Harbour | $4.42M | $1,448 | 2 |
| Sunny Isles Beach | $3.7M | $1,337 | 2 |
| Fort Lauderdale | $3.37M | $1,060 | 2 |
| Coral Gables | $3.17M | $1,016 | 4 |
| Brickell | $1.88M | $1,055 | 5 |
| North Beach | $1.82M | $925.72 | 2 |
| Design District | $1.65M | $974.39 | 2 |
| Edgewater | $1.31M | $842.27 | 2 |
| Little Havana | $932K | $531.36 | 2 |
| Downtown Miami | $770K | $668.19 | 2 |
| Wynwood | $632K | $675.39 | 2 |
| Aventura | $589K | $421.32 | 2 |
Homes for sale
Live data · updated October 7, 2026
| Neighborhood | Median price | Price / sq ft | Listings |
|---|---|---|---|
| Key Biscayne | $8.33M | $1,913 | 2 |
| South Beach | $5.45M | $1,879 | 3 |
| Mid-Beach | $8.75M | $1,614 | 3 |
| Bal Harbour | $4.42M | $1,448 | 2 |
| Sunny Isles Beach | $3.7M | $1,337 | 2 |
| Coconut Grove | $4.9M | $1,222 | 2 |
| Fort Lauderdale | $3.37M | $1,060 | 2 |
| Brickell | $1.88M | $1,055 | 5 |
| Coral Gables | $3.17M | $1,016 | 4 |
| Design District | $1.65M | $974.39 | 2 |
| North Beach | $1.82M | $925.72 | 2 |
| Edgewater | $1.31M | $842.27 | 2 |
| Wynwood | $632K | $675.39 | 2 |
| Downtown Miami | $770K | $668.19 | 2 |
| Little Havana | $932K | $531.36 | 2 |
| Aventura | $589K | $421.32 | 2 |
Rentals
Live data · updated October 7, 2026
Homes for sale
Live data · updated October 7, 2026
| Neighborhood | Median price | Price / sq ft | Listings |
|---|---|---|---|
| Brickell | $1.88M | $1,055 | 5 |
| Coral Gables | $3.17M | $1,016 | 4 |
| Mid-Beach | $8.75M | $1,614 | 3 |
| South Beach | $5.45M | $1,879 | 3 |
| Design District | $1.65M | $974.39 | 2 |
| Little Havana | $932K | $531.36 | 2 |
| Edgewater | $1.31M | $842.27 | 2 |
| Wynwood | $632K | $675.39 | 2 |
| Fort Lauderdale | $3.37M | $1,060 | 2 |
| Coconut Grove | $4.9M | $1,222 | 2 |
| North Beach | $1.82M | $925.72 | 2 |
| Bal Harbour | $4.42M | $1,448 | 2 |
| Sunny Isles Beach | $3.7M | $1,337 | 2 |
| Key Biscayne | $8.33M | $1,913 | 2 |
| Downtown Miami | $770K | $668.19 | 2 |
| Aventura | $589K | $421.32 | 2 |

Prices held firm, inventory finally grew and waterfront homes kept setting records. Here is what the third quarter means for buyers, sellers and renters.

Glass towers, rooftop pools and a Metromover stop on every corner. What it is really like to live in Miami’s financial district.

Eight weeks to moving day: a practical timeline for relocating to Miami, from school enrollment and driver’s licenses to hurricane supplies.
Get a free, data-backed valuation from a local Doorstep agent — no obligation, answered within one business day.
We use essential cookies to make the shop work, and, with your permission, Google Analytics and Google Ads cookies to understand traffic and measure our advertising. Read our Cookie Policy and Privacy Policy.
Choose which optional cookies we may set. You can change this any time from the “Cookie settings” link in the footer.